
✅ 중앙 집중화 로깅의 필요성
🤔 기존 로그 수집 방식의 문제점
1️⃣ 로그 확인의 불편함

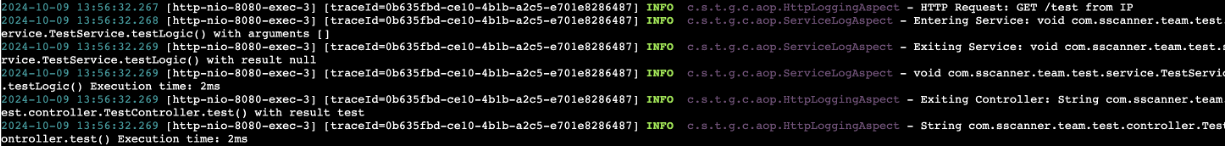
기존에 로그는 파일로 관리가 됐었다.
따라서 로그를 확인하려면 EC2 인스턴스에 들어가서 직접 명령어를 입력해서 확인했어야 했다.
또한 로그가 단순히 텍스트 형태로만 되어 있고 시간순으로만 저장되어 있어 내가 원하는 로그를 찾기가 매우 어려웠다.
2️⃣ 분산 환경에서의 문제
현재는 스프링부트 백엔드 서버의 로그만을 다루고 있어 크게 와닿는 부분은 아니지만 추후 로그를 수집하는 노드가 많아진다면 각각의 노드에서 로그를 확인하는 것이 매우 어려울 것이다.
💡 중앙 집중화 로깅

여러 시스템에서 발생하는 로그들을 한 곳에 모아 저장하고 그 데이터들을 적절히 가공해서 보여주는 하나의 체계를 의미한다.
이를 통해 다양한 환경에서 발생하는 로그들을 일괄적으로 관리할 수 있고 그 데이터들을 적절히 가공해서 의미있는 로그 데이터들을 별도의 UI를 통해 확인이 가능해진다.
✅ 다양한 중앙 집중화 로깅 솔루션
가장 많이 사용되는 중앙 집중화 로깅 솔루션은 크게 3가지 였다.
1. AWS CloudWatch
AWS 서비스와 연계가 쉽지만 요금이 들어가서 패스하였다.
2. ELK(Elastic search + Logstash + Kibana)
강력한 검색 및 쿼리 기능을 제공
무겁고 러닝 커브와 구축 및 운영 리소스가 있어서 패스하였다.
3. PLG(Promtail + Loki + Grafana) ☑️
대규모 데이터처리는 ELK에 비해 부족하며 레퍼런스가 적긴하지만
비교적 가볍고 설정이 어렵지 않으며 요구되는 리소스가 적어서 선택하였다.
✅ PLG 스택

Promtail: 로그 수집
- 서버 및 애플리케이션에서 발생하는 로그 파일을 읽고, Loki로 전송
- 로그를 구조화하고 필요한 메타데이터를 추가하는 기능을 제공
- Loki에서 쿼리를 효율적으로 수행할 수 있도록, 라벨을 붙여주는 전처리 작업을 수행
Loki: 로그 저장 및 인덱싱
- 로그를 저장하고 쿼리할 수 있는 로그 집계 시스템
- 라벨 기반의 메타데이터 인덱싱을 통해 빠르고 비용 효율적인 로그 검색을 지원
- Promtail로부터 수신한 로그를 라벨과 함께 저장하며, 필요 시 LogQL을 통해 쿼리
- 다른 로그 집계 시스템과 비교해 자원을 절약
- logfmt라는 로그포멧팅을 이용해서 별도의 필드를 지정할 수 있음
Grafana: 로그 시각화 (대시보드)
- 시각화 도구
- Loki에서 가져온 로그를 시각화하고, 다양한 쿼리를 사용해 로그를 분석할 수 있음
- 대시보드를 통해 실시간 모니터링 및 알림 설정도 가능
✅ Grafana & Loki 세팅하기
도커를 활용해서 개인적인 환경을 구축할 수 있지만 나는 편리함을 위해 Grafana Cloud를 활용했다.
무료 플랜으로도 충분한 기능을 활용할 수 있다고 판단했기에 선택했다.
Grafana Cloud | Observability platform overview
It didn’t take much time or effort to bring all these different data sources into a single Grafana dashboard using Grafana Cloud. From problem statement to having our first business dashboard up and running was two weeks. And now, months removed from our
grafana.com
Grafana

Loki
✅ Promtail 세팅하기
로그를 수집해서 전처리하고 Loki로 전송하는 역할을 한다.
0️⃣ Promtail 설정파일
server:
  http_listen_port: 0
  grpc_listen_port: 0

positions:
  filename: /tmp/positions.yaml

clients:
  - url: <https://${LOKI_USERNAME}:${LOKI_PASSWORD}@logs-prod-030.grafana.net/loki/api/v1/push>

scrape_configs:
  - job_name: logs  # 통합된 job 이름
    static_configs:
      - targets:
          - localhost
        labels:
          job: logs
          log_level: info  # info 레벨 라벨 추가
          __path__: /var/log/info/info-*.log
      - targets:
          - localhost
        labels:
          job: logs
          log_level: warn  # warn 레벨 라벨 추가
          __path__: /var/log/warn/warn-*.log
      - targets:
          - localhost
        labels:
          job: logs
          log_level: error  # error 레벨 라벨 추가
          __path__: /var/log/error/error-*.log
    pipeline_stages:
      # traceId 추출 (모든 로그에서 추출 가능)
      - regex:
          expression: '\\[traceId=(?P<traceId>[^\\]]+)\\]'

      # HTTP Request 관련 라벨 추출 (HTTP Request 메시지에서만 추출)
      - regex:
          expression: 'HTTPMethod=(?P<HTTPMethod>[A-Z]+) Path=(?P<Path>/\\S+) from IP=(?P<IP>[0-9a-fA-F:]+)'

      # ExecutionTime 추출 (ExecutionTime이 있는 메시지에서만 추출)
      - regex:
          expression: 'ExecutionTime=(?P<ExecutionTime>\\d+ms)'

      # 라벨 설정
      - labels:
          traceId: traceId
          HTTPMethod: HTTPMethod
          Path: Path
          IP: IP
          ExecutionTime: ExecutionTime
1️⃣ 로키 연결하기
clients:
  - url: <https://${LOKI_USERNAME}:${LOKI_PASSWORD}@logs-prod-030.grafana.net/loki/api/v1/push>
LOKI 데이터 소스 URL이다.
2️⃣ 로그 수집하기
- job_name: logs  # 통합된 job 이름
  static_configs:
    - targets:
        - localhost
      labels:
        job: logs
        log_level: info  # info 레벨 라벨 추가
        __path__: /var/log/info/info-*.log
    - targets:
        - localhost
      labels:
        job: logs
        log_level: warn  # warn 레벨 라벨 추가
        __path__: /var/log/warn/warn-*.log
    - targets:
        - localhost
      labels:
        job: logs
        log_level: error  # error 레벨 라벨 추가
        __path__: /var/log/error/error-*.log
이전에 로그 레벨에 따라 폴더를 나누어서 관리했었는데 그 파일들을 수집하겠다는 의미이다.
3️⃣ 라벨링
pipeline_stages:
  # traceId 추출 (모든 로그에서 추출 가능)
  - regex:
      expression: '\\[traceId=(?P<traceId>[^\\]]+)\\]'

  # HTTP Request 관련 라벨 추출 (HTTP Request 메시지에서만 추출)
  - regex:
      expression: 'HTTPMethod=(?P<HTTPMethod>[A-Z]+) Path=(?P<Path>/\\S+) from IP=(?P<IP>[0-9a-fA-F:]+)'

  # ExecutionTime 추출 (ExecutionTime이 있는 메시지에서만 추출)
  - regex:
      expression: 'ExecutionTime=(?P<ExecutionTime>\\d+ms)'

  # 라벨 설정
  - labels:
      traceId: traceId
      HTTPMethod: HTTPMethod
      Path: Path
      IP: IP
      ExecutionTime: ExecutionTime
라벨링은 로그메시지에 나타나는 특정 패턴을 통해 데이터에 라벨을 붙여서 쿼리의 효율성을 증가시켜주는 과정이다. RDBMS의 인덱스와 비슷한 개념이라고 생각하면 된다.
차후 쿼리를 작성할 때 조건으로 많이 활용될 데이터들을 라벨로 선정했다.
- traceId: 로그의 식별값
- HTTPMethod: GET/POST/PUT/PATCH/DELETE
- Path: API 경로
- IP
- ExecutionId: 실행시간
4️⃣ docker compose로 실행
services:
  promtail:
    image: grafana/promtail:latest
    container_name: promtail
    volumes:
      - /Users/user/Desktop/dev/java_workspace/2nd_project/promtail:/etc/promtail
      - /Users/user/Desktop/dev/java_workspace/2nd_project/log:/var/log
    environment:
      - LOKI_USERNAME
      - LOKI_PASSWORD
    command: -config.file=/etc/promtail/config.yml -config.expand-env=true
docker compose -f ./docker-compose/compose.promtail.yml up -d
✅ 라벨링을 위한 로그메시지 수정
앞서, promtail로 라벨링을 할 때, 다음과 같이 regex패턴을 지정했었다.
pipeline_stages:
  # traceId 추출 (모든 로그에서 추출 가능)
  - regex:
      expression: '\\[traceId=(?P<traceId>[^\\]]+)\\]'

  # HTTP Request 관련 라벨 추출 (HTTP Request 메시지에서만 추출)
  - regex:
      expression: 'HTTPMethod=(?P<HTTPMethod>[A-Z]+) Path=(?P<Path>/\\S+) from IP=(?P<IP>[0-9a-fA-F:]+)'

  # HTTP Response 관련 라벨 추출 (HTTP Response 메시지에서만 추출)
  - regex:
      expression: 'ResponseCode=(?P<ResponseCode>\\d+) ResponseMessage=(?P<ResponseMessage>[^ ]+) ResponseData="(?P<ResponseData>[^"]*)"'

  # ExecutionTime 추출 (ExecutionTime이 있는 메시지에서만 추출)
  - regex:
      expression: 'ExecutionTime=(?P<ExecutionTime>\\d+ms)'

  # 라벨 설정
  - labels:
      traceId: traceId
      HTTPMethod: HTTPMethod
      Path: Path
      IP: IP
      ResponseCode: ResponseCode
      ResponseMessage: ResponseMessage
      ResponseData: ResponseData
      ExecutionTime: ExecutionTime
이 패턴에 맞게 로그 메시지를 수정해주도록 하겠다.
1️⃣ Controller 로그 AOP
수정 후
@Component
@Aspect
@Slf4j
public class HttpLoggingAspect {

    private long startTime;

    // Controller의 모든 메서드에 대해 적용
    @Pointcut("execution(* com.sscanner.team..controller.*.*(..))")
    public void pointCut() {
    }

    @Before("pointCut()")
    public void logHttpRequest(JoinPoint joinPoint) {
        MDC.put("traceId", UUID.randomUUID().toString()); // 멀티 스레드 환경에서도 로그를 구분할 수 있게 해줌
        startTime = System.currentTimeMillis();
        HttpServletRequest request = ((ServletRequestAttributes) RequestContextHolder.currentRequestAttributes()).getRequest();
        log.info("HTTP Request: HTTPMethod={} Path={} from IP={}", request.getMethod(), request.getRequestURI(), request.getRemoteAddr());
    }

    // 메서드 호출 후 정상적으로 반환된 경우 로그 남기기
    @AfterReturning(pointcut = "pointCut()", returning = "response")
    public void logAfterReturning(JoinPoint joinPoint, ApiResponse<?> response) {
        HttpServletRequest request = ((ServletRequestAttributes) RequestContextHolder.currentRequestAttributes()).getRequest();
        log.info("HTTP Response: Path={} ResponseCode={} ResponseMessage={} ResponseData=\\"{}\\""
                , request.getRequestURI(), response.getCode(), response.getMessage(), response.getData());
    }

    // 예외 발생 시 로그 남기기
    @AfterThrowing(pointcut = "pointCut()", throwing = "ex")
    public void logAfterThrowing(JoinPoint joinPoint, Throwable ex) {
        HttpServletRequest request = ((ServletRequestAttributes) RequestContextHolder.currentRequestAttributes()).getRequest();
        // 특정 비즈니스 예외 처리: Todo: 이런 비즈니스 예외에 대한 부모클래스를 선언해서 코드를 깔끔하게 하기
        if (ex instanceof BadRequestException badRequestEx) {
            log.warn("HTTP Response: Path={} ResponseCode={} ResponseMessage=\\"{}\\" ResponseData=\\"{}\\""
                    , request.getRequestURI(), badRequestEx.getCode(), badRequestEx.getMessage(), null, ex);
        } else if (ex instanceof DuplicateException duplicateEx) {
            log.warn("HTTP Response: Path={} ResponseCode={} ResponseMessage=\\"{}\\" ResponseData=\\"{}\\""
                    , request.getRequestURI(), duplicateEx.getCode(), duplicateEx.getMessage(), null, ex);
        } else if (ex instanceof MethodArgumentNotValidException) {
            String errMessage = Objects.requireNonNull(((MethodArgumentNotValidException) ex).getBindingResult().getFieldError()).getDefaultMessage();
            log.warn("HTTP Response: Path={} ResponseCode=400 ResponseMessage=\\"{}\\" ResponseData=\\"{}\\""
                    , request.getRequestURI(), errMessage, null, ex);
        } else {
            // 그 외의 예외는 기본적인 에러 로그로 처리
            log.error("HTTP Response: Path={} ResponseCode=500 ResponseMessage=\\"{}\\" ResponseData=\\"{}\\""
                    , request.getRequestURI(), ex.getMessage(), null, ex);
        }
    }

    // 완전히 종료된후 메서드 실행시간 측정하기
    @After("pointCut()")
    public void logAfter(JoinPoint joinPoint) {
        HttpServletRequest request = ((ServletRequestAttributes) RequestContextHolder.currentRequestAttributes()).getRequest();
        long executionTime = System.currentTimeMillis() - startTime;
        log.info("HTTP Execution: Path={} ExecutionTime={}ms", request.getRequestURI(), executionTime);
        MDC.clear();
    }

}
2️⃣ Service 로그 AOP
수정 후
@Component
@Aspect
@Slf4j
public class ServiceLogAspect {

    private long startTime;

    // service의 모든 메서드에 대해 적용
    @Pointcut("execution(* com.sscanner.team..service.*.*(..))")
    public void pointCut() {}

    // 메서드 호출 전 로그 남기기
    @Before("pointCut()")
    public void logBefore(JoinPoint joinPoint) {
        startTime = System.currentTimeMillis();
        log.info("Entering Service: Method={} with Args={}", ((MethodSignature) joinPoint.getSignature()).getMethod().getName(), Arrays.toString(joinPoint.getArgs()));
    }

    // 메서드 호출 후 정상적으로 반환된 경우 로그 남기기
    @AfterReturning(pointcut = "pointCut()", returning = "result")
    public void logAfterReturning(JoinPoint joinPoint, Object result) {
        log.info("Exiting Service: Method={} with Return={}", ((MethodSignature) joinPoint.getSignature()).getMethod().getName(), result);
    }

    // 완전히 종료된후 메서드 실행시간 측정하기
    @After("pointCut()")
    public void logAfter(JoinPoint joinPoint) {
        long executionTime = System.currentTimeMillis() - startTime;
        log.info("Method={} ExecutionTime={}ms", ((MethodSignature) joinPoint.getSignature()).getMethod().getName(), executionTime);
    }
}
✅ Grafana 대시보드 구성하기

1️⃣ HTTP METHOD 분포도

sum by(HTTPMethod) (count_over_time({job="logs"} | HTTPMethod != `` [$__auto]))
2️⃣ 상위 API 10개

topk(10, sum by(Path) (count_over_time({job="logs"} | Path != `` | HTTPMethod != `` [$__auto])))
3️⃣ IP 분포도(상위10개)

topk(10, sum by(IP) (count_over_time({job="logs"} | IP != `` [$__auto])))
4️⃣ 예외 발생 로그보기

특정 traceId 클릭시 좌측에서 해당 로그를 자세하게 볼 수 있음

{job="logs", log_level="warn"} | traceId != `` | line_format `{{.traceId}}`
{job="logs", log_level="error"} | traceId != `` | line_format `{{.traceId}}`
5️⃣ API별 예외발생 빈도

topk(10, sum by(Path) (count_over_time({job="logs", log_level=~"warn|error"} | logfmt | Path != `` [$__auto])))
6️⃣ API별 평균 실행 시간

avg_over_time({job="logs"} | regexp `Path=(?P<Path>\\S+)
ExecutionTime=(?P<ExecutionTime>\\d+)ms` |
ExecutionTime != `` | Path != `` | unwrap ExecutionTime [$__auto]) by (Path)
참고
주니어 개발자의 서버 로그 관리 개선기
SpringBoot Application과 Grafana 기반의 Metric & Log 모니터링
6 easy ways to improve your log dashboards with Grafana and Grafana Loki | Grafana Labs
'데브코스 > 실습 & 프로젝트' 카테고리의 다른 글
| [2-3차 프로젝트] Grafana 알림 기능 사용하기 (0) | 2024.11.05 |
|---|---|
| [2-3차 프로젝트] Grafana Loki: logfmt와 Promtail 라벨링 성능 비교 (0) | 2024.11.03 |
| [2-3차 프로젝트] AOP & Slf4j를 통해 로깅 구현하기 (1) | 2024.11.03 |
| [2-3차 프로젝트] Sonar를 통해 코드 정적분석하기 - 3. SonarCloud 활용법 (0) | 2024.10.28 |
| [2-3차 프로젝트] Sonar를 통해 코드 정적분석하기 - 2. 프로젝트에 Sonar 분석 도입하기 (1) | 2024.10.28 |